Home
Browsing the database
Regional Index (Parents of immigrants)
Regional Index (Parents of Foreigners)
Help and references


Genealogy of the French in North America
DNA and Genealogy
More detailed explanation
The beginner should first read the
summary of this text.
Basics - Y-DNA
Genealogy is usually based on documents. Thus, if the
marriage record of Andrew and Bertha indicates that the
father of Andrew is Charles, we will enter Charles in our
databases. But, it is possible that the biological father
is a friend, a traveler, etc. This is the difference
between genealogy and genetics. In genealogy, we trust the
paper trail while in genetics, the facts can be different
but are closer to the biological reality.
DNA is the common tool to connect genealogy and genetics.
It is a code that each person carries within itself. The
Human DNA contains about 30,000 genes or features in 23
pairs of chromosomes, one of which is called the Y
chromosome. During centuries, these genes undergo
alterations or mutations that distinguish families. To do
this, often, a sample of DNA extracted from the inside of
the cheek is analyzed and a number of markers are
extracted. Then, we compare the values of these markers
and can identify the signature of the path of men (male or
patrilineal). For the mothers' line, the mitochondrial DNA
(or mtDNA) plays the same role.
DNA won't tell us how many generations separate two men
with the same signature. A documentary trail is required
to compare their patrilineal lines. The generation where
these lines intersect to overlap corresponds to the
Most Recent Common Ancestor (or MRCA, ACPR in
French, for ancêtre commun le plus récent).
If the paper trail genealogy doesn't find a common ancestor, there are several possibilities, which can be summarized in a non-parental event (NPE):
- The adoption, which is sometimes known. To avoid
making this text too complicated, we assume that if
there is not MRCA or if the markers are too different,
there was adoption, but other cases are possible.
- A child born out of wedlock or illegitimate. This
situation is similar to the previous one. However, if
the biological father is related to the legal father,
the NPE may not be detectable (eg, if the biological
father is the father, brother, cousin, etc. of the legal
father).
- An error in the records or homonyms or similar couples.
- A mistake in the genealogical research.
- A common ancestor much further than the beginning of the known male line, for example, the pioneers are distant cousins with different surnames (the signature can be the same or almost for several millennia).
- The change of name or identity (identity theft).
- Etc.
Also, the more markers you find in the test, the more differences you may accept.
If you're not familiar with French genealogy, keep in
mind that French surnames appeared in the 1300s in
general. In addition, there was New France many nicknames
and some families have left the original family to take
this nickname. Sometimes there were two changes. Thus, in
my own line, the family name was successively Jarret dit
Hugon (France, circa 1500), Jarret dit Jacquemin (France,
1580), Jarret dit Beauregard (Quebec, 1676-1900) and
Jarret dit Vincent (Quebec, 1700-1900). This is the same
family that has changed 4 times a nickname, and the
descendants now use Beauregard, Vincent and Jarret, and
some variations like Jarest or Sharray. But among the
Quebec's Vincent, only 10% descend from the Jarret family,
the other 90% being from another family. Instead of
linking a signature to a family name, it is better to
associate a series of couples with family links, as in the
present database.
mtDNA
The Y-DNA discussed above is used to identify male lines
(women do not have the Y chromosome).
The 22 pairs of chromosomes shared by men and women come from both parents and no marker is inherited systematically through several generations. Instead, we use the mitochondrias, micro-organisms transmitted from a mother to her children. Sons and daughters receive mitochondrias from their mother. Human children do not inherit mitochondrias from their biological father (but this is possible for some animals). These mitochondria have DNA and it can be used to identify a female or matrilineal lineage.
For purposes of discussion, the Y-DNA is used as an
example, but the concepts are the same with mtDNA (or
mitochondrial DNA), except that it is a line of women and
the surnames are rarely transmitted.
The most important difference is probably that mtDNA does
not follow the path of surnames in our culture, so if two
signatures are similar, then the documentary error is
small (but not zero). In comparison with the Y-DNA, if
parentage is wrong (for example, the marriage record is
lost or does not show the parents or if there are
homonymous couples), the probability is better to get the
right ancestor.
Another important difference is that while only one Y chromosome Y is given to the son, the mother will transmit many mitochondries to her child. So, it is possible the mtDNA signature is not easily summarized. One person could be tagged as having different haplogroups (see below) depending on which mitochondries are analyzed.
Autosomal DNA
This concept is not used in this database. It is mentioned so that you can understand what it is if you want to test your DNA.
For some analyzis, 22 or 23 pairs of chromosomes are used. Some markers are associated with the concept of race or regions. In theory, we can determine that such person would have 25% Indian blood, that is to say 25% of the markers are common among Native Americans. Some tests from some laboratories may be wrong. For instances, one of them advertised as Scandinavian markers that were not specific to Scandinavia. Other markers can be used to find remote cousins if enough persons are tested. A test from FTDNA made for this purpose is called Family Finder.
The autosomal DNA is used by police to identify a suspect. It also allows you to validate if a person is a relative of another. Used for medical purposes, it helps to know if the person tested has some gene associated with a disease. For each of these tests, the markers may be different. For the moment, these data are not used in the database of the Genealogy of French in North America. However, Métis couples are identified and Native American couples are stored in our database.
DNA may also detect some hereditary sickness (or genes
favoring a given illness). This is why it is a bad idea to
publish all the markers found by a test. For example,
mtDNA contains 3 groups : HVR1, HVR2 and Coding region.
The part named "Coding region" is considered as private.
That said, the raw data received from a typical laboratory are about 700,000 values (or markers). Actually, the scan chip finds about 150,000 valeurs and computes the other by intrapolation (or imputation). Each laboratory is processing its own markers and intrapolation allows to compare results between laboratories. With the technology of today, you can find cousins back to 6 about generations (even 8 in Québec and Acadia because of the founding effect) but when they are too far (after 4 generations from each tested), it is almost impossible to identify the common ancestors (there are too many).
Haplogroups and SNP
Family sheets with DNA signatures ahve tables like the
following ones.
First of all, lets talk about costs. We can detect a mutation (SNP), a group of mutations or measure statistics (Y-ST) about the whole DNA without knowing what are the mutations. Detecting one SNP is the cheapest (about $15 each at Yseq.net), followed by the Y-STR markers (the number depends on the price, and finally by detecting a large number of SNP. The Y-STR are less stable and can be counted (in comparison, the SNP is there or not) and the counts allow to compare 2 signatures and their "genetic distance", If the distance is zero, the 2 signatures have the same values, but the common ancestor can be very far.
In the next table, the haplogroup was detected with
accuracy by the most recent mutation (SNP) in Y-DNA. It is
also presented the nodal notation allowing to see the
evolution in the time (the sequence being, for example, ,
E, E1, E1b, E1b1, etc.).
The sequence of mutations is known because of heredity :
once a mutation appears, it remains usually in the next
generations. Below, a tested person had the SNP L793 and
another the L117. L117 has the L793 by heredity but not
all L793 have L117. The less expensive mean to know if you
have the same signature as your ancestor would be to
compare that mutation L117 (if you are in this family).
This mutation is not known a priori. You can do a lot of
SNP tests or a test with many Y-STR to predict the SNP.
Some are also guessing for the next mutation. Colors were
changed in the 2016 release and nodal notation deleted
(the reference was not stable).
| Y-DNA
computed (by male descendance only) : Haplogroup from SNP : E-L793>L117 |
The haplogroup can also estimated from other tests (12 to
111 Y-STR markers). This kind of prediction is based on
statistics. In both cases, if Y-ST markers are known, they
are displayed after the haplogroup.
The nodal notation is used to be sure 2 different
mutations are compatible. For instances, the mutation
E-L117 is E1b1b1 in nodal notation while E-L793
corresponds to E1b1b1b2a1d. You can see they are matching
: E1b1b1b2a1d, the first being contained by the
other. This nodal notation is not stable, however. Indeed,
the hierarchy of mutations is revised from time to time
and this nodal mutation may change. It is thus best to use
the other format, i.e. E-L793 in this example.
If the nodal notation is short (like R1b or J2), this usually means the haplogroup was estimated from the STR while a larger tag indicates often that the SNP were searched.
| Y-DNA
computed (by male descendance only) : Haplogroup from Y-STR : R-M269 |
To be sure no adoption occured, a signature must be triangulated, that is it must be computed from 2 descendants in male line (or female line for mtDNA). These lines are integrated into the GFNA database. The persons along the path from the common ancestor to the tested persons have "computed" Y-DNA (green background) while the other have a "predicted" DNA (yellow background_ (with a error rate around 10% for 10 generations because of a possible adoption.
With female lineages, the haplogroup is computed from SNP
shown as signature. rCRS compares with the European Eve
(or first theorical woman) and RSRS with the African Eve.
| mtDNA
predicted (by female descendance only) : Haplogroup : A10 Signature (rCRS) : A73G, A235G, A263G, 315.1C, 522-, 523-, C544T, C16223T, A16227C, C16290T, T16311C, G16319A, T16519C Signature (RSRS) : C146T, C152T, C195T, A235G, A247G, 315.1C, C544T, A16129G, T16187C, C16189T, A16227c, G16230A, T16278C, C16290T, G16319A |
Also, from release 2016a, possible signatures were added, so that more people will send to the French Heritage project their lines for validation or will be tested. Only the haplogroup is shown in these cases. Reliability ia based on the number of tested persons. In many cases, the pioneer can't be identified and the signature is not used.
| Y-DNA
presumed by convergence (by male descendance only) : Haplogroup from SNP : R-M269>P312>Z220 Reliability : 90% |
From release 2018, the complete signature is at the
bottom of the family sheet and there is only one line
under the name of parents (with the same color) to
indicate the signature is below. Some signatures may have
111 values, which may hide the family data.
Triangulation or convergence
If the signature is obtained by triangulation, it
comes from 2 tested persons with a common ancestor (line
was tested and completely male or female except the tested
person if mtDNA). In some cases, the common ancestor is
unknown but the lineas share the same family name and the
same area of origin. The risk for an error is almost zero
(the pioneer could have adopted 2 children having the same
father for example).
If the signature is obtained by convergence, it
comes from 1 or more tested persons for which the line
wasn't validated to the pioneer. There is always a risk of
error, particularly if the descendant made an error during
the research or if there was an adoption or not-parental
event (NPE).
In other words...
Lets see that again, with more technical terms.
Markers form two categories, SNP (single-nucleotide
polymorphisms or changes at a specific point) and STR
(Short Tandem Repeats or number of repetitions of
sequences).
The information obtained from the SNPs is summarized as
the haplogroup. Its name begins with a letter. These
groups are divided by adding alternately letters and
numbers to form sub-clades (nodal notation). To simplify
the presentation, we will talk about haplogroups only, but
do not be surprised by other terms such as subclad
found in the literature. As more and more DNA is analyzed,
some haplogroups were more numerous and therefore, for
purposes of presentation in charts, some haplogroups are
identified by a letter (A, B, C, etc..) and others by a
group of letters R1a, R1b, etc. These groups are then
divided using mutations in the genes. A mutation may be
rare (or slow) or common (or fast). Rare mutations are
used for first divisions of groups, then more frequent for
more divisions. In addition, a haplogroup is usually a
subdivision of another haplogroup.
For Y-DNA (male), haplogroup is often displayed without
detailing the SNP markers
Y haplogroups follow two conventions : by successive mutations (the more recent SNP) and by categories (nodal notation).
The Quebec's Jarret dit Beauregard have the haplogroup R1b1a2 (nodal notation). Over the centuries, there has been changes that have passed by haplogroup R1b and R1b1, R1b1a etc.. This chain of mutations shows that a group is derived from another, but the chain can become quite long. A panel of experts then turns these strings into categories. Our R1b1a2 is also called R-M269 (or haplogroupe R and mutation M269) and the signatures of the database containing the two forms.
The P group (DNA-Y) produced subgroups Q and R. R formed R1 and R2 and R1 gave R1a and R1b. So, there is also a hierarchy of haplogroups.
With mtDNA (women), the SNP markers are displayed but
there are also two conventions RSRS and CRS (or rCRS), the
CRS form being used in the database. On the FTDNA web
site, the form RSRS looks like A73G while CRS is like 73G,
but actually, the prefix is an option and no prefix
doesn't mean the CRS form is in use. DNA is formed by 4
basis summarized by pairs of letters A and T, C and G. The
prefix is the default value for that position. The
difference between A73A and A73G is that A73A is the
default value (never shown anyway) while A73G has a change
from A to G for the position 73. If you want to compare,
you must then be sure all data follows the same
convention.
On the other hand, it is not necessary to check all the
SNP markers to find the haplogroup. For example, the Geno2
test is based on about 3000 mt markers (they are not
identified) and the result is limited to markers that are
different from the reference values. If the reference
value is A73A (or 73A, the prefix is an option) and the
measured value is A, you won't see that value in the
results file. But if the measure is A73G, the file will
include the line 73 G G. Since there are 22 pairs of
chromosomes, there are 2 fields for the letter. For X and
Y chromosomes of men, the field is repeated, like for the
mt chromosome.
Timeline of haplogroups is computed from recent tests and
knowledge of history and human migrations. Datation is
thus approximated. Moreover, the sequence in which
mutations occured is not always obvious. Y-DNA subclades
are often identified by many possible mutations. Lets look
as an example to the chart of group R on http://www.isogg.org/tree/ISOGG_HapgrpR.html.
The mutation P310 is copied to the next line:
|
R1b1a2a1a - L151/PF6542, L52/PF6541, P310/PF6546/S129, P311/PF6545/S128 |
Haplogroup R1b1a2a1a can be identified by finding
one of the following mutations L151, PF6542, L52, PF6541,
P310, PF6546, S129, P311, PF6545, S128. It can be
summarized by R-L151, R-P310, etc. Note : the nodal
notation is not fixed. It can change when mutations are
moved from one line to another. In this project, it is
used to compare tests. On the other hand, nodal notation
is no more used in the GFNA database.
Markers and STR
STR data is relatively independent from SNP data. There are two different measurements and it is theoretically possible that two people have the same STR markers but SNP data (or haplogroup) different (or actually not-compatible). That is why these two pieces of information are important when you want to compare signatures. STR markers (or Y-STR) can be found for the Y-DNA. Here is a sample result.
| Y-DNA
predicted (by male descendance only) : Haplogroup : R1b1a2/R-M269 DYS393=14; DYS390=24; DYS19=14; DYS391=11; DYS385=11-15; DYS426=12; DYS388=12; DYS439=13; DYS389i=13; DYS392=13; DYS389ii=30; |
Here are the data from 12 markers ("DYS385 = 11-15" means
DYS385a = 11 DYS385b and = 15, so 12 items). The number of
markers and their choice depends on the lab. The FamilyTreeDNA
site offers tests with 12, 25, 37, 67 and 111 markers.
Instead, AncestryDNA provided 33 and 46 markers (but this
product is discontinued) while Genebase has 20, 44, 67 and
91 markers. The ISOGG
web site compares some laboratories.
Sometimes, one can deduce the haplogroup from STR
markers, but an error is possible. Actually, some
laboratories don't measure any SNP and derive their
results only from STR. Also, there are tests to compute
directly a SNP. STR were removed from the 2024 release.
Triangulation
Because there are adoptions and other NPE, it is always
possible that the markers found are not those of the more
distant known ancestor. This is why we try to triangulate
lineages, or to find two or even three descendants from
the common ancestor and having the same markers. The Most
Recent Common Ancestor (MRCA) is the first common male
ancestor (in a male line) and he have the same Y-DNA
signature as the two or three tested people if the markers
are identical. Same applies to mtDNA and female lineages.
Signatures are considered as reliable for the tested men, the MRCA and the lineages between the MRCA and the tested men. For all other persons in the family (brothers, cousins, uncles, etc.), there is risk someon was adopted. Reliability increases if there are more signatures and more lineages from sons of the MRCA. This also applies to female lineages and mtDNA.
In this database, the signatures are identified according to the triangulation.
The signatures in family sheets between the MRCA and those tested are identified as cation as Y-DNA computed or mtDNA computed. The signatures are propagated to other families where the same signature is predicted if there is no adoption or other NPE. They are then known as Y-DNA predicted or mtDNA predicted. Warning: this database has family sheets. The Y-DNA is that of the father (and his sons) and mtDNA, of the mother (and her children, but only transmitted by females to the next generation).
Most immigrants arrived alone in New France, Acadia or Louisiana. MRCA is this immigrant if he had several married son (Y-DNA) (or, for mtDNA, the female immigrant with many married daughters). If the immigrant has one married child, you must go down to the next generation or the one that follows, until we find enough children to triangulate. Conversely, if the brothers or sisters immigrated together, you can have the signature of the previous generation, although in some cases, the name of that person may be unknown. For example, the descendants of the sisters Langlois mtDNA have the same signature, but we do not know the name of the mother of Marguerite Langlois wife of Abraham Martin nor the mother (of course it is the same person) of her sister Françoise Langlois who married Pierre Desportes.
Geography of DNA
The haplogroup is often used to estimate the region of
origin of the lineage in question (i.e. 5,000 or 25,000
years ago). To understand what this means, we must know
how these haplogroups are created. First of all, the Y-DNA
haplogroups and mtDNA are independent.
This
map shows the Y-DNA haplogroups (at the top) and
ANDmt (at the bottom) in year 1500 (before the arrival of
Europeans in America). It shows the composition of the
population in some areas. For example, the Y-DNA in the
Cheyenne population (CY) in the center of the United
States, has approximately 75% A, 8% B and 17% C. In
Central Asia, the SL group contains 65% A, 17% R1a, etc..
In France, it is 55% of R1b, 25% I, 10% R1a, J 8% and 6%
E3b. So we can see that, on one side, a haplogroup is in
several places in varying proportions, and on the other
side, at each location, the local population is not
uniform. Moreover, these figures are for 2005 and are
estimated from graphs. Current figures may be different.
Also, the tests were conducted recently while these are
estimates for populations living 500 years ago. Thus, this
is a projection and not a direct measurement.
Concentrations are different for mtDNA. The Eastern
Native Americans have 40% A, 28% X, 25% C, etc.. The same
haplogroup A is also found in lesser amounts in the Uzbeks
of central Asia. The human trend being to simplify, many
confuse the facts. Thus, the haplogroup A is common among
the Indians but it is also found in Asia.
In this regard, let's talk about the controversy about
the mtDNA of the king's daughter Catherine Pillat, wife of
Pierre Charon (GFAN family sheet 812). Her haplogroup is
A10. We see the A is typical in Amerindian populations.
However, A is also found in Asia and this group includes
divisions derived from rare mutations. We have the A2
subgroups typically Native American, while A10 is common
in some populations of Central Asia, including some tribes
people who invaded Europe more than a millennium ago.
Catherine descends from these tribes and is not Native
American. On the FamilyTreeDNA site, a search for A10
shows only the descendants of Catherine, while A2 displays
several Amerindian (French_Heritage_DNA project) and other
groups A1 and A3 to A9 show no data. Mutations associated
to groups A10 and A2 are differentes (see
this table). From our research, Native American
haplogroups include, for Y-DNA, P-M45, C-P39
and Q1a, and for mtDNA, A2,
B2, C1 and D1 (X is not sure and
some searchers believe it is European).
Limitations of DNA
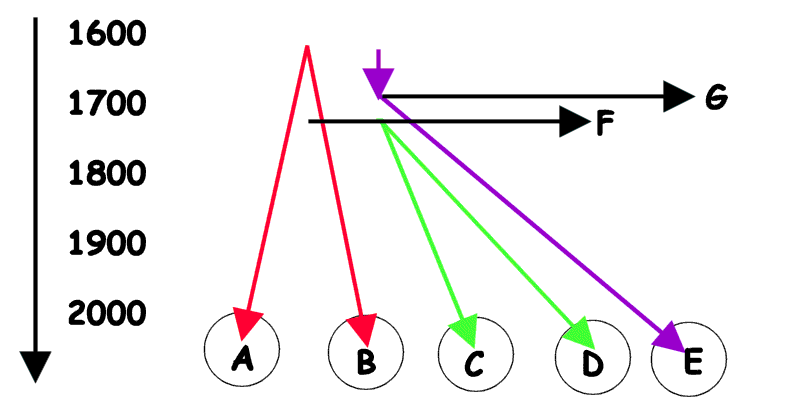
The same markers are used to group families, but they do
not say where the link (common ancestor) is located. See
the following chart. Lets consider three people as an
example, i.e. Albert (A), Basile (B) and Charles (C). A
and B have a common ancestor (Abraham, born about 1600) 10
generations from them (Abraham had two sons, Adam and
Bertrand), and similar markers (red lines). C has the same
markers (green line) but his genealogical line is
different. Odds are good that the C line includes an
adoption (or a child born out of wedlock), the father
being from the same family as A and B. But, it is not
possible to know who is the biological father or when the
adoption occured. It is even possible that the common
ancestor is a cousin living before these families migrated
to New France !
It may be approximated by some clues. We can find that
Daniel (D), a cousin of C having the same marker as A and
B (green line) to find the generation where the adoption
occured, and Ernest (E), descendant from the adoptive
father (Étienne) having different markers (violet line).
At the point F, we conclude that the ancestor of A
(André), B (Bertrand) or their cousin (Henri) would be the
biological father of the ancestor of C and D (or Cédric),
while at the point G, documents say that Ernest, the
ancestor of E is the father of Cédric, the ancestor of C
and D.
To summarize, documents (the paper trail) tell us that :
Abraham is born around 1600 and had 2 sons, Adam and
Bertrand. Adam is the ancestor of Albert, and Bertrand the
ancestor of Basile. Abraham is also the ancestor of Henri.
Then, Étienne, born about 1650, arrived in the colony. He
would be the father of Cédric. Cédric is the ancestor of
Charles and Daniel. Étienne is the ancestor of Ernest.
DNA teaches us that actually, Étienne adopted Cédric or that Henri a traveler made a child to the wife of Étienne (it is usually not possible to know what happened). However, Étienne is the biological ancestor of Ernest (providing another descendant of Étienne was tested), while Abraham is the biological ancestor of Albert, Basile, Charles and Daniel. DNA won't tell who is Henri, if he is in line A or B or another line.
Benefits of DNA
DNA tests are very popular among Americans. Documentary evidences are less available than in Quebec and this helps to explain some of its popularity in USA. In addition, the anglicized names after immigration makes it more difficult to find the ancestral line. The new name can be very different from the old one. If it is obvious to see the change from Fairfield to Deschamps (champ means field) or Ashley to Dufresne (frêne means ash), for example, but Deshan descends from Deschênes in Maine and Sharray were Charest and Jarret before moving to Michigan. However, if the descendant remembers his ancestor was Leblanc instead of Laplante or the ancestor switched from Sansfaçon to Simpson, the paper trail is more complicated to follow !
In other cases, a DNA test helps to find an error in the
evidences. For example, while working on the Catherine
Pillat case, there was another pioneer with the same
unexpected haplogroup A10. After this extended study, it
was found that the actual ancestor was also the same
Catherine Pillat.
Source and credit for signatures
Most signatures come from the<catalogue
of the French
Heritage DNA project
that cumulates DNA signatures for the last 10 years to
achieve triangulations to validate signatures included in
the database of the Genealogy of French in North America
(GFNA). Some are from other projects. The author would appreciate to get
access to other projects about the French in
America so as to help to solve dead ends and to
improve the quality of data in the GFNA
database. In some cases, data are not from a
project, but from matches to someone in a
project, when the participant has no forwarded
his/her male or female line. When
validating your ancestry in the light of the predictions
made about your DNA based on GFAN data, consider sending
me a copy of your line at DNA@francogene.com !
© Copyright 2013-2026 Denis Beauregard